Climate Justice
#Social Vulnerability
#Technology and Environmental Conflict
#Urban Heat Island
#Environmental Injustice
Exhitbitor
Tzu-Ping LIN
Exhibition Team
BCLab
Team Member
Szu-Yi LEE
View the Printed Edition (PDF)
CLIMATE JUSTICE
UHI Effect in Taiwan: Real-Time Monitoring, Historical Data, and Future Projections
Taiwan’s urban areas are experiencing severe heat island effects. On June 29, 2020, Taipei reached 38.9°C.$ the highest for the month, and on July 24, temperatures hit a record 39.7°C. Urban temperatures are much higher than in suburban areas due to impermeable surfaces, dense buildings, and artificial heat sources like vehicular emissions and air conditioning. As urbanization intensifies, temperatures in cities can exceed suburban levels by 3°C to 5°C, increasing thermal stress, and impacting public health, energy consumption, and environmental stability.
To acquire real-time temperature data for a comprehensive understanding of the urban heat island effect, Professor Tzu-Ping Lin of NCKU’s Department of Architecture leads BCLab in establishing the High Density Street-level Airtemperature Observations Network (HiSAN) across six metropolitan areas in Taiwan. HiSAN provides refined downscaled data. By integrating land use, land cover, building height, and climate change data produced by the National Science and Technology Center for Disaster Reduction (NCDR), BCLab examines climate variations from the urban built environment to the neighborhood and building scales. This approach enables precise assessment of urban heat hazards under global warming. Gridded data visualization supports spatial analysis, enhancing real-time monitoring and early warning.
Regarding historical climate data, BCLab utilizes the long-term climate dataset TReAD (Taiwan ReAnalysis Downscaling data), produced under the National Science and Technology Council’s TCCIP project with a 2 km resolution. These maps provide precise tools for studying the urban heat island effect. For future projections, BCLab uses HiRAM data under the RCP8.5 scenario, covering baseline (1995–2014) and future warming scenarios of 2°C(2034–2053) and 4°C (2073–2092). By integrating real-time, historical, and future data, BCLab enables detailed analysis of urban extreme heat, while incorporating exposure and vulnerability data is crucial for assessing the full impact on the environment, society, and economy.
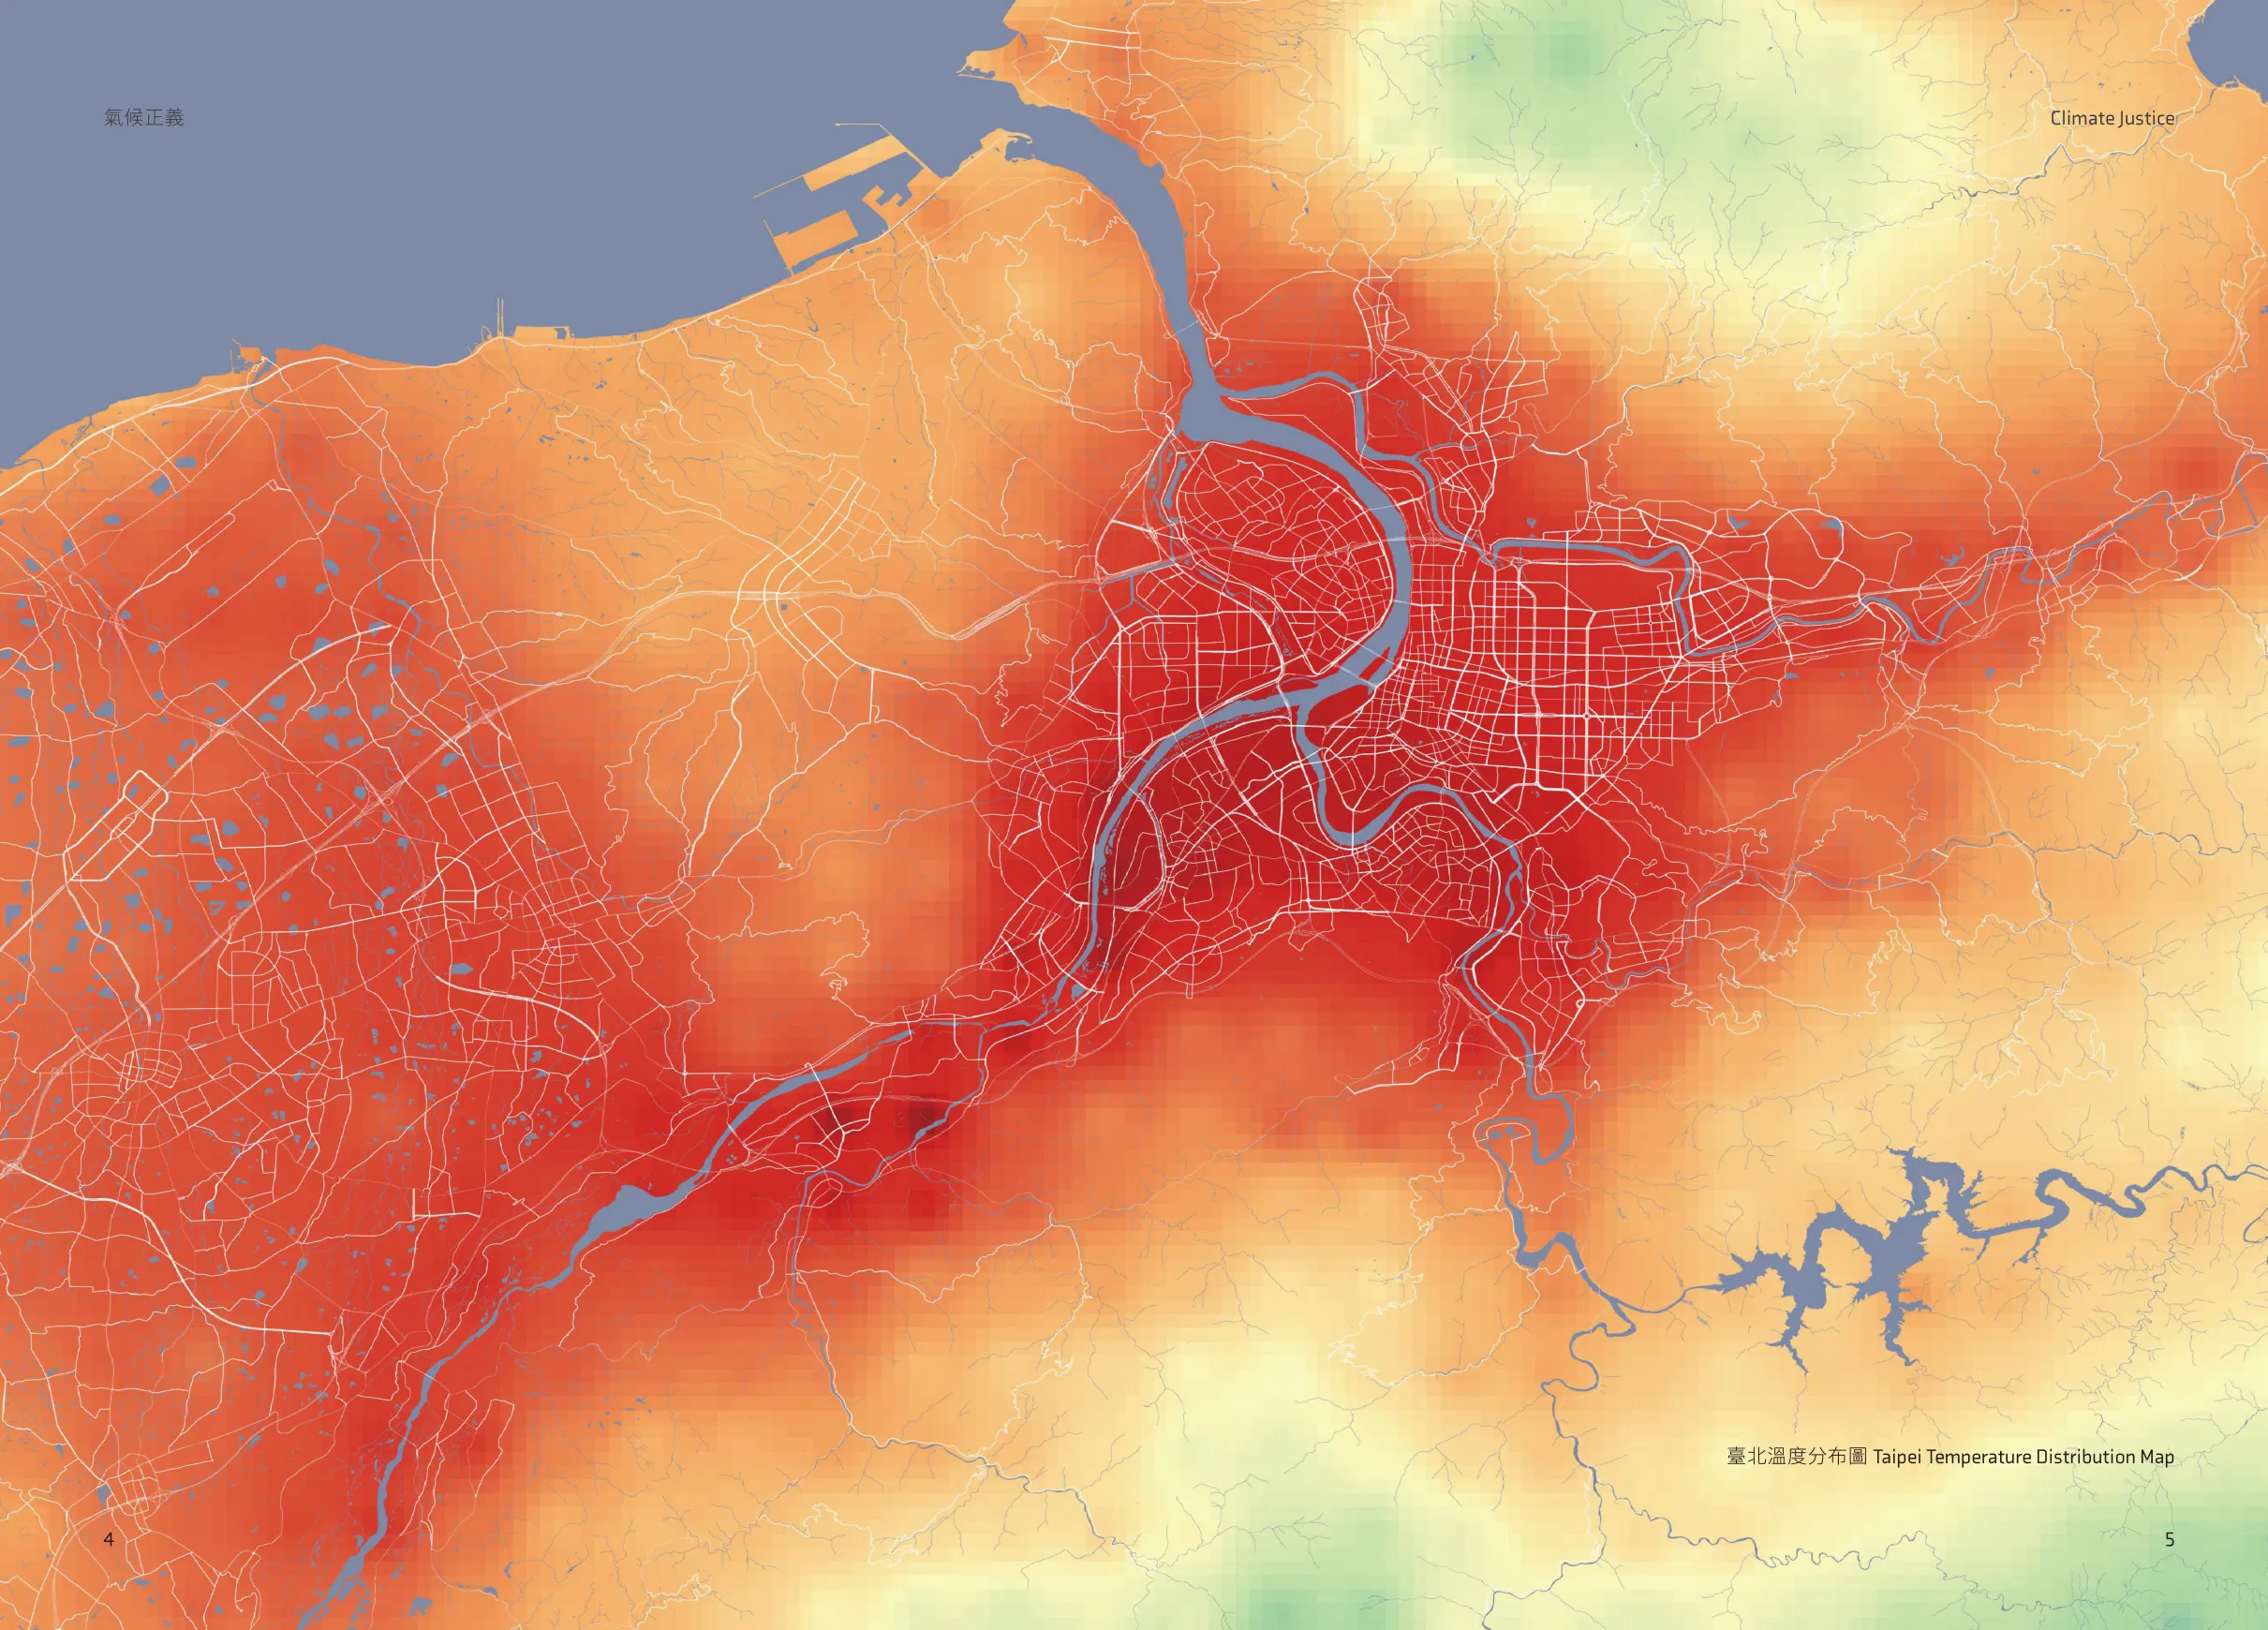 Taipei Temperature Distribution Map
UHI Effect Exacerbates Social Vulnerability and Environmental Injustice
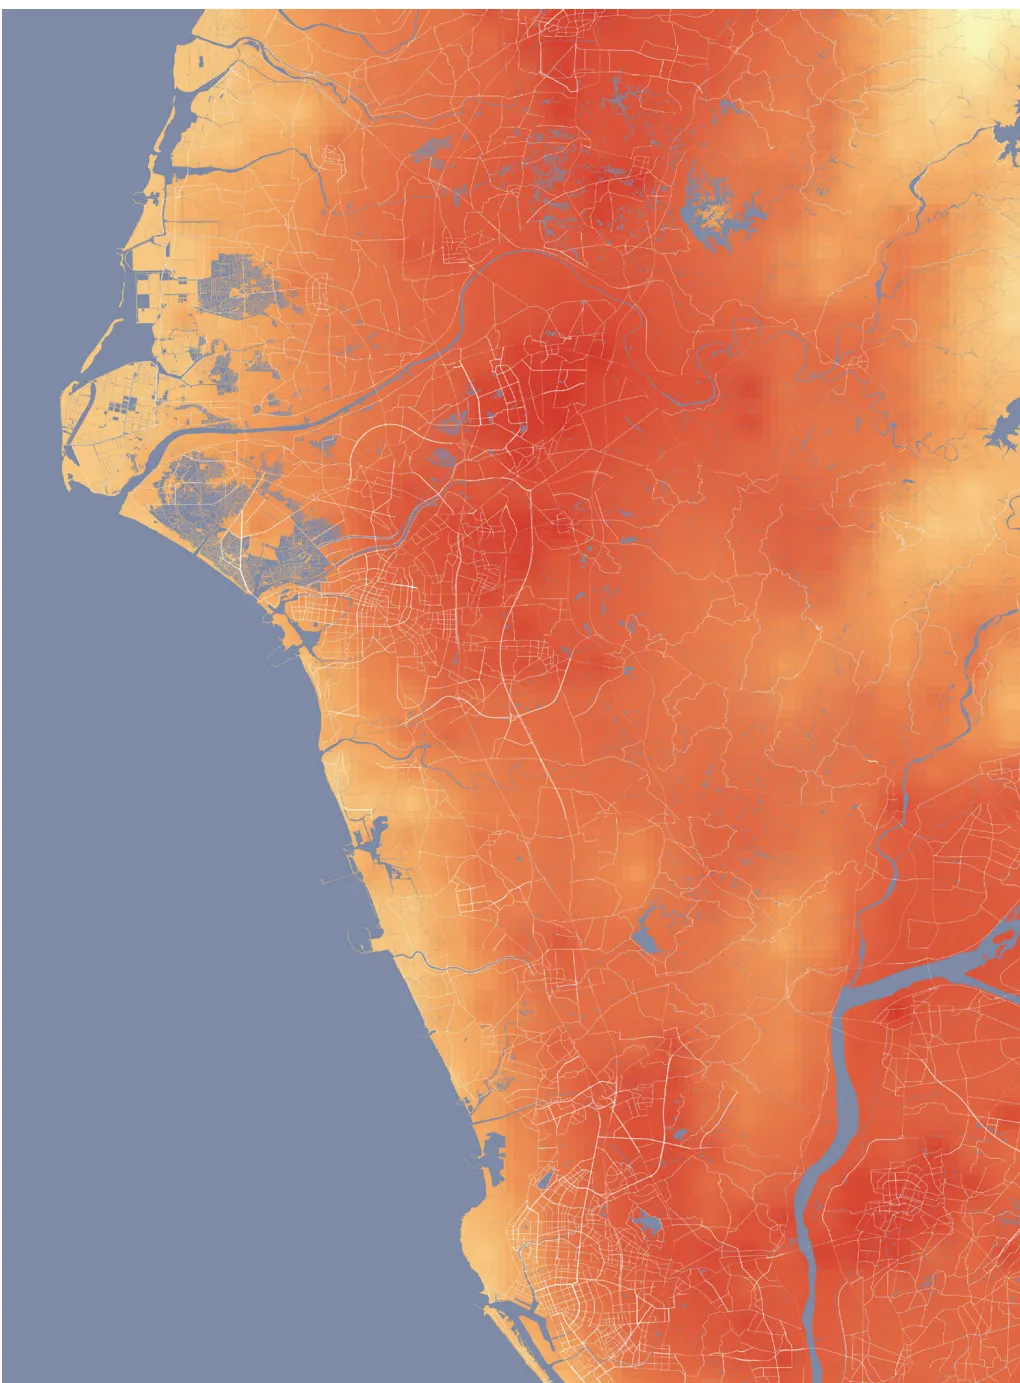 Temperature Distribution Map of Southern Taiwan (Tainan, Kaohsiung, Pingtung)
BCLab investigates the socio-economic impact of the urban heat island effect on social vulnerability. Using a decade of summer temperature data analyzed by the National Science and Technology Center for Disaster Reduction, the study assesses regional socio-economic conditions, including economic status, population structure, and medical resource distribution.These indicators effectively measure the potential damage a region may face during extreme heat events and its capacity for response, resistance, and adaptation.Drawing from the “Socio-Economic Data Service Platform” and using the “Secondary Statistical Area” as the spatial unit, six indicators are examined: number of businesses, populations under 14 and over 65, number of medical institutions, population with low education levels, and low-income households. These metrics evaluate regional vulnerability, resilience, and adaptation capacity to extreme heat, with a focus on Taipei’s district-level disparities.
BCLabs research findings indicate that socioeconomically vulnerable areas in Taipei are primarily concentrated in Zhongshan and Wanhua districts, while lower-vulnerability areas are mostly located in central administrative districts with higher incomes and well-developed infrastructure. Despite being in high-temperature zones, Da’an and Songshan districts exhibit relatively low vulnerability due to their stronger adaptive capacity.Additionally, the 2020 Taipei City Traffic Opinion Survey Report reveals that 8.6% of Wanhua residents commute or travel to school by walking—significantly higher than in other districts—while only 4.9% use private cars, a notably lower proportion. This suggests that while Wanhua has a lower environmental burden, it faces a heightened risk of extreme heat, highlighting issues of environmental injustice.Understanding the spatial distribution of socio-economic vulnerability enables more effective resource allocation, helping mitigate climate impacts on disadvantaged groups and strengthening overall societal resilience and adaptive capacity.
Beyond its impact on social groups, the urban heat island effect—intensified by rising temperatures and rapid urbanization—has significant environmental, ecological, health, and socioeconomic consequences. Rapid economic growth and dense urban development, characterized by extensive concrete structures, impervious surfaces, and heat from economic activities, contribute to rising urban temperatures. Meanwhile, the reduction of natural blue and green spaces disrupts environmental balance and weakens temperature regulation, further amplifying the heat island effect.
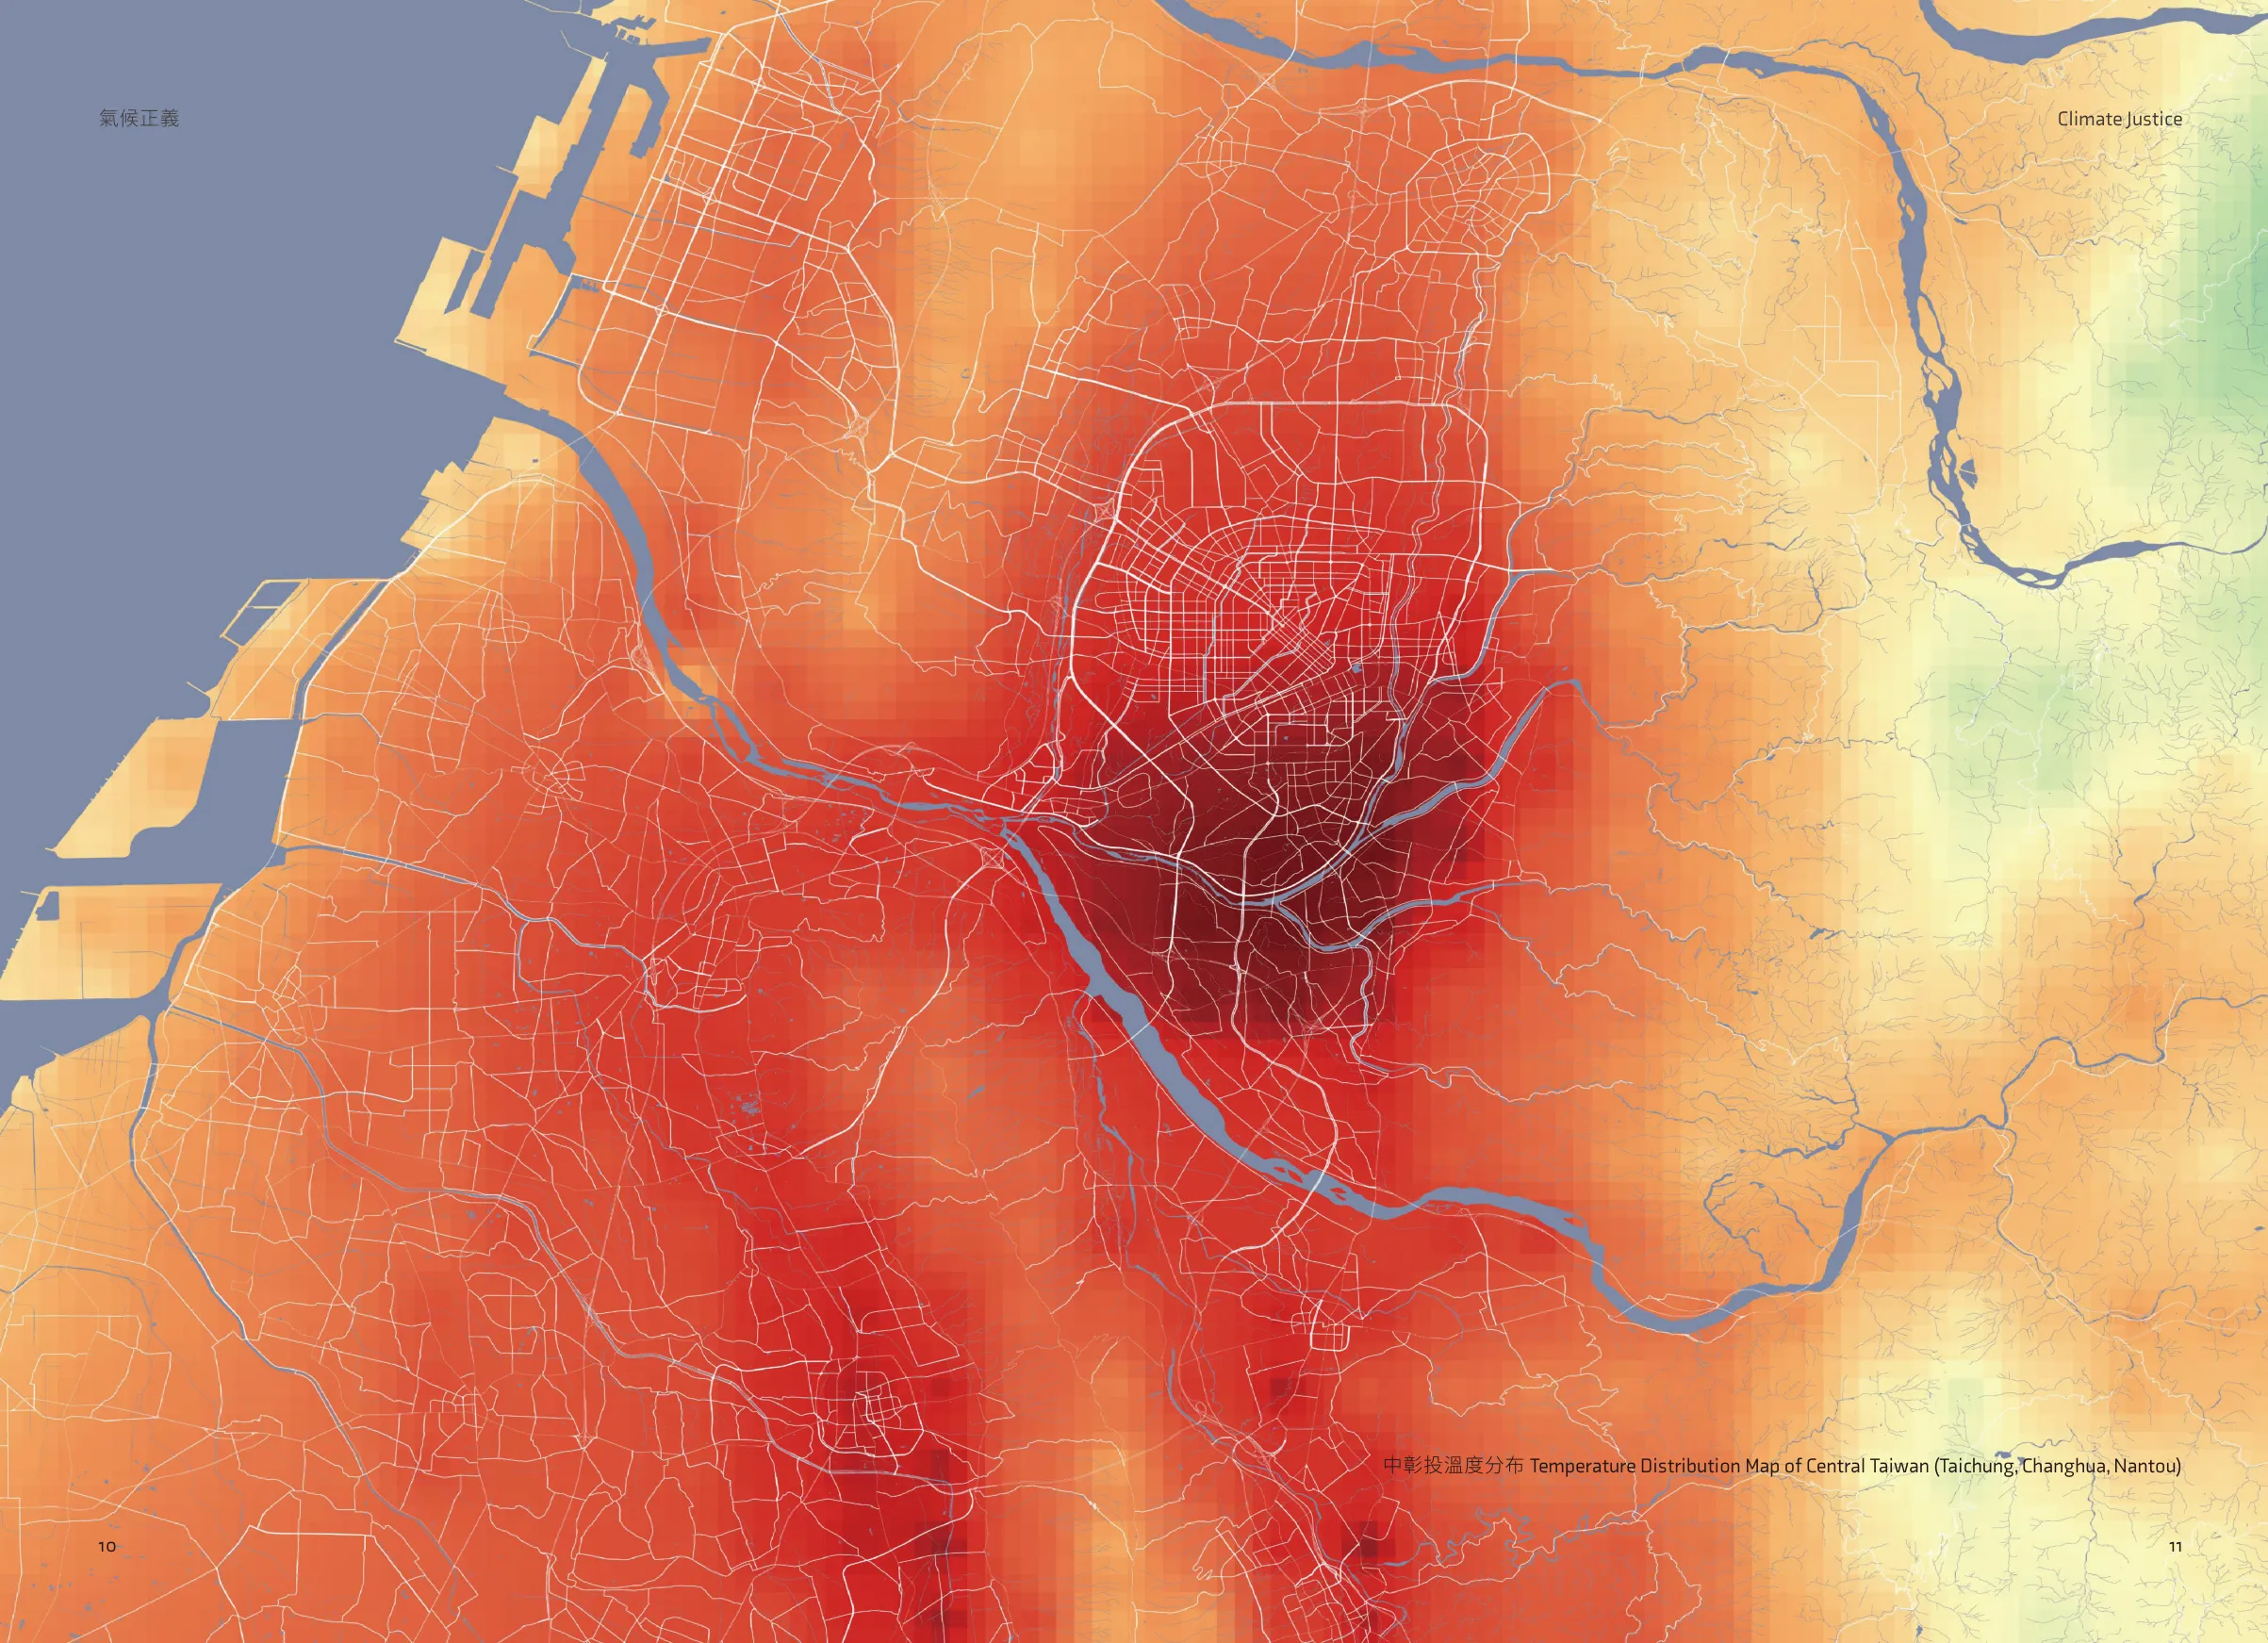 Temperature Distribution Map of Central Taiwan (Taichung, Changhua, Nantou)
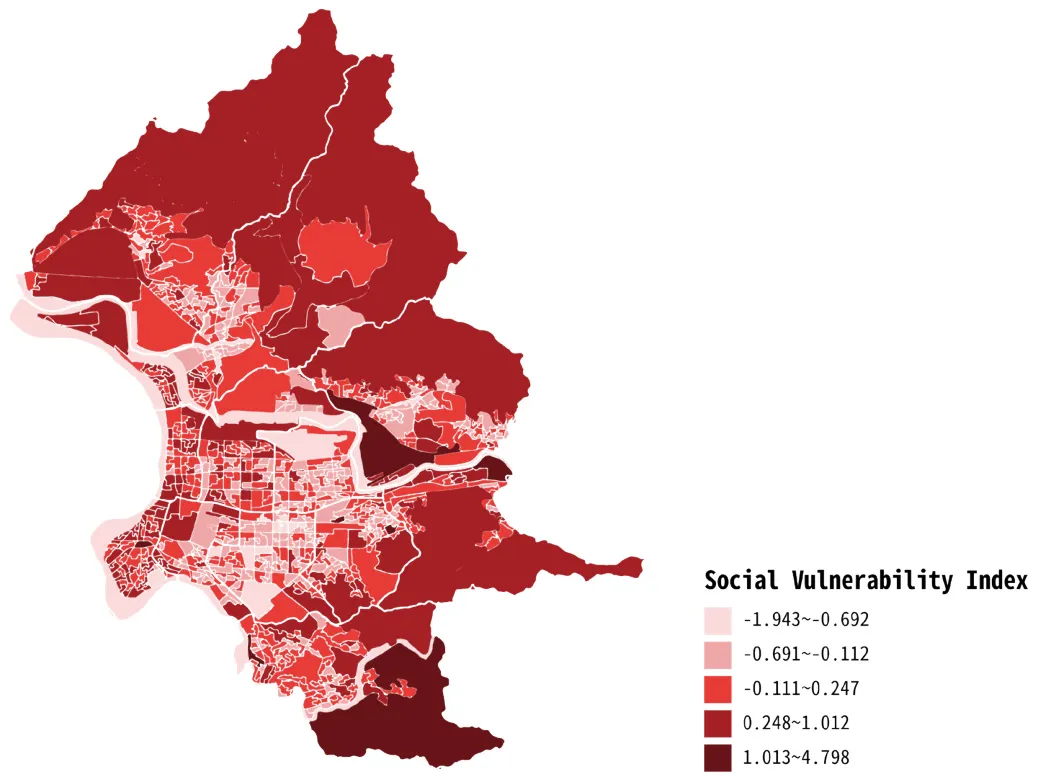 Taipei City Social Vulnerability Index
 Overlay Map for Temperature Distribution Study in Taipei
 Temperature Difference Distribution Map with Da’an Forest Park And Taipei
Urban Energy Use & Greenhouse Gas Emissions: UHI Impact & Responses
Greenhouse gas emissions from urban and building electricity consumption are an indirect consequence of the urban heat island effect. According to the National Land Surveying and Mapping Center’s analysis of Taipower’s residential and commercial electricity data, combined with land use and development intensity, Taiwan’s six major metropolitan areas exhibit the highest perunit land electricity consumption. Traditional city centers in eastern Taiwan, such as Hualien, Taitung, Yilan, and Nantou, also show elevated electricity usage, with some industrial zones consuming even more. A significant portion of urban electricity consumption is attributed to air conditioning, which generates heat and exacerbates urban temperatures, creating a feedback loop that increases energy use.
In Taipei and New Taipei City, the basin topography traps heat, and coupled with intensive urban development, temperatures in the city center are often over 3°C higher than in suburban areas. This increasingly frequent phenomenon highlights the intensifying urban heat island effect, making the mitigation and adaptation to high outdoor temperatures a critical issue. Additionally, studies show that residential buildings in hightemperature urban centers experience higher indoor temperatures than those in cooler suburban areas, leading to greater electricity consumption. The urban heat island effect impacts not only thermal comfort and public health but also social, economic, and energy consumption patterns. To address these challenges, the government must enhance adaptation measures through policy and technological advancements to reduce environmental impacts and ease energy burdens.
To address the urban heat island effect, Taiwan enacted the Climate Change Response Act on January 10, 2023, establishing a goal for netzero greenhouse gas emissions by 2050. This act provides the legal framework for future climate management and related regulations. In addition to regulating carbon emissions from urban development and human activities, it also strengthens controls on high-temperature hazards and air quality degradation.
In terms of local government policy, the Taipei City Government has initiated a heat environment survey to assess the distribution of high summer temperatures and develop heat island mitigation strategies for select demonstration areas. The Taipei City Department of Urban Development aims for a 2°C target and has integrated natural and artificial shading evaluations into building design, beginning with public buildings as models. Additionally, the city has revised greening regulations, shifting from a focus on total greening area to incorporating the shading and cooling effects of individual trees. The updated regulations promote systematic shading structures and introduce an innovative “green volume rate” plan, with benchmark standards tailored to various site scales and characteristics.
In Taichung, based on local climate conditions and prior studies, areas with a Physiologically Equivalent Temperature (PET) exceeding 45.5°C are designated as heat zones, prioritized for remediation. The city government has proposed four primary cooling strategies: water-green cooling, ventilation and heat dissipation, shading and cooling comfort, and energy conservation and emission reduction, all integrated into urban planning. For high-temperature zones, the government has developed short-term, midterm, and long-term action plans. Additionally, adopting international wind corridor policies, the city classifies urban wind corridors into three levels based on wind resistance characteristics and implements corresponding regulations for each level. These measures reflect the local government’s commitment to addressing the urban heat island effect and enhancing residents’ quality of life in response to climate change. Through science-based cooling initiatives, the city aims to foster collaboration among the public, government, designers, builders, and maintainers, selecting appropriate strategies to improve urban heat conditions, strengthen environmental awareness, and enhance adaptive capacity.